Mining Social Media for Link Building
April 17, 2012
In the past few years, Social Media has become the token buzzword in the online marketing world both its instant nature and the ability to relatively easily reach huge audiences in a targeted and measurable way. These qualities have obviously not escaped the SEOs amongst us and social media has almost instantly become one of the promotion vehicles of linkable content.
Soon enough, SEOs started speculating whether social signals have a more important role in search engine ranking algorithms than just a way to push content. When Danny Sullivan asked search engine reps about the possibility of them using this new signal in ranking algorithm, the responses were generally positive – yes we look at the social signals in a variety of ways. As it usually happens with search engine reps when they are asked specific questions about signals in ranking algorithms, they left a lot of the questions unanswered or unspecific: are social votes counted towards web pages in the same way links are? What is the value of social interactions that do not include links? Is there a secondary effect of social votes on links through trust and authority signals linking pages may earn from social votes? If the quality/authority of social shares is tightly connected to different personas, which in turn are parts of social networks, will the social signals influence results mostly in personalized search results or will it happen in un-personalized SERPs as well?
As soon as these questions started to arise, people started experimenting with social signals, trying to rank pages based on tweets or Facebook Likes (this was before G+ existed), while trying to prevent links from influencing the rankings. The issue with these experiments was a common problem that researchers encounter – Observer- Expectancy Effect – in which the presence of the experimenter and/or their cognitive bias can alter the results of the experiment. In the case of social media signals experiments, it was not the cognitive bias that influenced the outcome, but rather the relatively high profile of the experimenters which caused their tweets/FB Shares with links to the content they were experimenting with to be 1) widely retweeted and 2) scraped and shown on different Social Media analysis/curation websites (such as, now discontinued trunk.ly) where they were readily available for search engines to index and count as links. Furthermore, the spike in links and social media mentions has probably tripped some sort of Quality Deserves Freshness algorithm which pushed those results to temporary top rankings for relevant queries.
What is missing from all of the investigation and analysis of social media signals as potential pure ranking signals is the following scenario:

In this scenario there are no indexable links pointing to the page, only social media signals, which cause (or not) the testing page to achieve long term, organic, non-personalized rankings. The truth is that due to current and constantly growing interconnect-ability of social media services with different web-based curating services, it is doubtful there will ever be a possibility to perform such an isolated experiment.
In the meantime, we still have Social Media as an un-precedented targeted, focused and measurable method of placing linkable content in front of the relevant people that will most likely link to it. So far this has been done in a way that does not utilize all the potential that social media provides us. Here at RankAbove, we have developed a way to analyze social sharing patterns of social media users, based on competitors’ social media promotion efforts, in order to achieve maximal linking potential and use those insights in planning and executing social media based link building outreach campaigns. Needless to say, these methods are being incorporated into our Drive Enterprise SEO Tool and will provide a competitive edge to our clients looking to perform more sophisticated social media based link building outreach campaigns.
Firstly, one of the principles of every automated data-mining algorithm is, what we like to call, the Minesweeper Effect. Remember playing the classic Windows game in which you have to correctly identify the location of mines in a grid, based only on numbers, representing the number of mines in all neighboring squares? So whenever you would click on a field that does not have any mines around it, a relatively large number of fields would open up and provide you with a lot of opportunities for the next step in the game.

This is what we call, “The Minesweeper Effect” in which a relatively small number of data points (or clicks) reveal a disproportionally large amount of analyzable data. This is something we were looking to incorporate into our algorithm – by providing a small input representing competitors’ link building effort, we are aiming to gather a large number of relevant link building opportunities with a high social sharing potential.
Why ?
What is the logic behind this method? When describing different social media strategies for link building, people usually employ similar methods in which they look at who shared certain content and use the list of those sharers as their target for social media outreach.

However, each of those users keeps sharing stuff and the content that they are sharing, most probably gravitates around a limited list of topics, all related to their scope of interests. (unless they are spammers). Therefore, looking at all the other things that they share could provide us with a more focused target list for our link outreach.

This list will not only be more valuable because it is better focused around a specific niche, but also will come with an additional benefit – it will represent a list of domains that host content interesting to people that are willing to share that content. Furthermore we can perform additional analysis on the shared content and social media users that have shared and rank it according to a number of relevant criteria:
– Number of back-links that each shared piece of content gathered since shared
– Number of unique linking domains linking to the shared piece of content
– Content that was shared by more than one user from the curated list of users
– Users that have shared more than one piece of content from the curated list of shared content
– Content that is relevant to a large set of your target keywords
– Domains that are already linking to you (and those have higher chances of linking to you again)
– Domains that are not linking to you yet (and thus represent better link expansion targets)
– Domains that are linking to your competitors but not to you (and thus may represent the competitive difference between you and competitors that are currently outranking you)
– Domains that are not linking to your competitors nor to you (and thus may represent the potential competitive back-link advantage)
– Etc.
This is where this blog post will get technical and all Excel-ly. If you don’t wish to read the technical explanations, just click here to jump to the analysis part.
How?
Obviously, the best way to do this is to use APIs of different services in order to pull data on social and linking metrics of different pieces of content, incorporate them into a database which will grow over time and provide more and more data points for future analysis. At RankAbove, our team of programmers has developed methods to gather and incorporate this data into Drive in the optimal manner. However, we want to provide even a non-technical user with the capabilities to gather and analyze this data. Therefore, for the purpose of this post, we have done all the analysis and data scraping in Excel. We will provide a sample Excel file at the end of this post that includes all the formulas and lists used to scrape the APIs, with detailed instructions on how to use it.
So how do we gather this data? The principle behind it is pretty straightforward. We start by identifying a linkable piece of content that we want to analyze. Since I am such a huge fan of using Excel for SEO analysis, I have chosen to analyze two very important articles on this topic: Excel for SEO Guide by Mike Pantoliano from Distilled Seattle office and NielBosma’sSEOTools for Excel Plugin page.
Our sources of data will be the following APIs:
| Service | API URL | |
 |
List of users: | http://otter.topsy.com/trackbacks.json?url=http://www.exampleurl.com |
| List of URLs | http://otter.topsy.com/linkposts.json?url=http://twitter.com/someusername | |
 |
# of FB Likes | https://api.facebook.com/method/fql.query?query=select%20like_count%20from%20link_stat%20where%20url= ‘http://www.exampleurl.com/‘&format=json |
| # of FB Shares | http://graph.facebook.com/?id=http://www.exampleurl.com | |
 |
http://urls.api.twitter.com/1/urls/count.json?url=http://www.exampleurl.com | |
 |
http://enterprise.majesticseo.com/api_command?app_api_key=XXXXXXXXXX&datasource=fresh&cmd=GetIndexItemInfo& items=1&item0=http://www.exampleurl.com |
|
Notice the bolded parts; that is where you will insert the information relevant to your site. Also notice that right now every source of link data which is somewhat usable and provides relevant data currently requires payment. For the purposes of Drive, we like to use MajesticSEO (reasons for this are explained in our research of all the major back-link data providers) and for the purpose of this research, I have used Majestic Fresh Index, however you can use any of the other available back-link data providers that have an available API, assumed that you make the right adjustments in the appropriate Excel formulas.
The tools which we will use to extract the data are MS Excel and the excellent SEOTools for Excel Plugin page.SEOTools is a plugin you add on top of your regular Excel to provide additional capabilities. We will mostly use the scraping capabilities, found in the Scraping module, although some Social metrics will be gathered through this tool as well. I highly encourage you to take a look at the other functions provided by this plugin as they will enable you to do advanced things you thought only programmers were capable of. The main function from the SEOTools plugin we will use is DownloadString. It enables us to pull any API query result into Excel as a regular text string and perform all the string-relevant functions on it
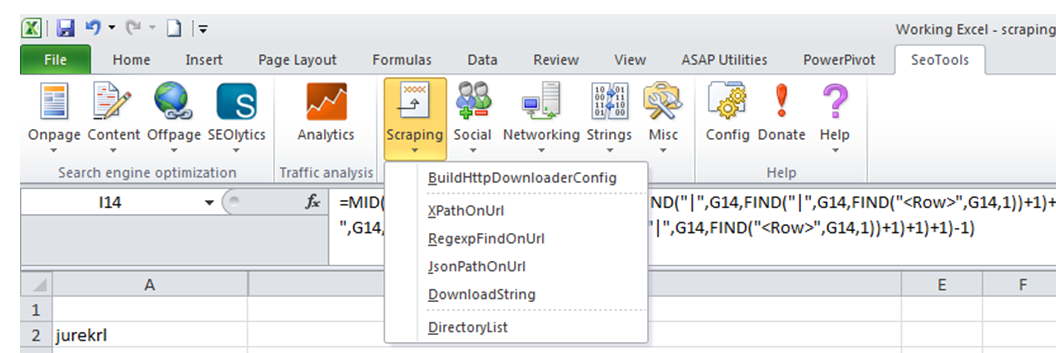
So let’s start with scraping the list of users that have shared the content we are investigating:

As you can see, the output of the Topsy API query is a regular text file. You can pull this file into Excel by using the DownloadString function, found in the Scraping menu of the SEOTools for Excel plugin. We are looking for the Twitter usernames of people that have shared the article and I have outlined the location of usernames in the API output file pictured above. All we have to do in Excel is use the FIND function to locate the string “nick” and “cut out” the username using the function MID. After that, using the location of the found username as a starting point, we look for the next occurrence of the word “nick” in the file and so on. This may sound trivial (does it?) but in reality the Excel formula needed to perform this task looks like this:
=MID(DownloadString("http://otter.topsy.com/trackbacks.json?url="&D$1&"&perpage=50"),B5+7,FIND("""",DownloadString("http://otter.topsy.com/trackbacks.json?url="&D$1&"&perpage=50"),B5+7)-(B5+7)Luckily, you don’t have to try and reconstruct the formula, as we have provided a handy sample Excel file for you to download and use with your data.
So after getting a list of usernames that have shared your competitor’s content, next we want to take a look at what each of those users has shared and gather social and link signals for each piece of shared content.In order to do that, we will again use the Topsy API, but this time calling a different function – linkposts.json:

Just like in previous example, we have to look for the field names that mark the URLs and yank them out of the textual output of the API function, using the FIND and MID Excel functions. It takes some tweaking to get it right but in the end, you should be able to provide a username as an input and get a list of URLs they have shared:

The numbers you see in the columns C and D are positions of the [“link”,”url”:] strings with the text file, used to locate the URLs. In a regular program, written in one of the programming languages, the algorithm would just go over all the curated usernames, harvest the URLs of the shared links and store them in a database for further manipulation. Since we are trying to do this without coding and in Excel, we can’t automatically go through the usernames, however in order to make the process as easy and flowing as possible, I have setup a drop-down box that pulls all of the Twitter usernames from the original scraped list so you can just choose the existing usernames one by one and copy-paste the URLs that appear in the column E. Important: When copy-pasting the data, make sure that you copy paste it as values and not as formulas, otherwise, your spreadsheet will try and recalculate the data every time you change something and cause huge hang-ups while trying to access different APIs.
Next thing we want to do for each of the gathered URLs is get the social and linking data and that is done in the same manner as described for scraping usernames and URLs just with different APIs, as outlined in the chart above. I am not going to go through it step-by-step as it all works on the same principle like finding and excising the usernames method described above and it is all done in the downloadable Excel file. The number of RTs, FB shares and likes and Links and Linking Domains are scraped from respective APIs (notice that for MajesticSEO API for link data, you will need a subscription) while the +1 data is gathered from the SEOTools for Excel Plugin, using the social module:

Notice that the SEOTools for Excel has also the ability to pull RT and FB Likes numbers but I have found these numbers to be inaccurate.
The final output spreadsheet should look something like this:

Now you can start slicing and dicing the data, filtering for different values or creating different pivot tables. Notice that I have added columns K and L, containing the basic domain name of the shared URL (K) and an indication whether the shared page is a Homepage or an internal page. These indications make analysis easier and more granular, but you may want to add additional layers of data onto this.
Analysis
OK, so what can we do with all this data we have gathered? Firstly, we were interested in how number of links plot against different social media metrics. In order to extract some meaningful insights from this data, we have to make a number of generalizations and assumptions. For example, it is obvious that links are not created only by exposure and sharing of content on social media channels. As there is no way of isolating the links that were seen in social media and shared only because of that exposure, we will have to assume that social media exposure will contribute enough of a trend across the board that those pieces of content that have garnered more links due to social media sharing, will stick out. Additionally, a lot of content is shared over more than one social media channel; therefore, one cannot make distinctions in contribution of single social media channels towards link building. Again, we will seek refuge in large numbers – we will assume that if we look at enough data-points, trends will begin to emerge where content that is shared more in a certain social media channel, will get more links, proportionally to the level of exposure.
So what does it exactly mean “to plot links against different SM metrics”? When we want to describe to variables as one being a function of the other or one being caused by the other, we plot them as a simple linear function:

In this case, number of links is represented on the Y axis and number of tweets on the X axis. We say that a function Y(links) = a*X(links) + b describes the relationship between the links and tweets, i.e. how quickly the number of links changes as a function of the number of tweets. This function is represented by a line and the angle at which this line rises is called “the slope of the graph” and is represented by the variable “a” in the function above. So if a=1, the function is Y=X and we say that each tweet resulted in a link. If a>1, then each tweet resulted in more than one link, proportionally to the value of a. Higher the value of a, faster the graph rises, larger the slope of the graph is and less tweets are needed to produce a single link (or more links are produced as a result of a single tweet). Notice that this is a very simplified model, there is a number of things that may or may not be accurate in the representation, for example, the relationship between the two variables does not need to be linear, it can be logarithmic, exponential, polynomial or many other different relationships, but for the purposes of this very generalized view of relationships between links and different social media variables, we are going to work with the linear model. Also, we are going to extract the linear formula of our data by using Excel-created trend lines and those tend to be created at varying levels of accuracy, but, again, since we are trying to get a general, 30,000 feet view of the social media play-field, we will just have to decide that these approximations are good enough. However, when looking at the analysis outcome, we have to remember that the numbers are a gross approximation and only vastly different outcomes can be instructional as to differences between different social media channels.
So what does the data we gathered show? First, let’s look at the relationship between retweets and the number of links/unique linking domains:


In the above graphs, the thin black line represents the trendline (or the linear function approximating the data) while the thick maroon line represents the x=y function, which only serves for the purpose of comparison. As you can see in the graphs, both values of “a” for back-links and linking domains are significantly lower than 1, meaning that on average, in reality RTs produce less than one links per tweet (more than one tweet is needed to produce a link). Similar situation is encountered when looking at the number of FB Likes and FB shares vs. number of back-links and linking domains:

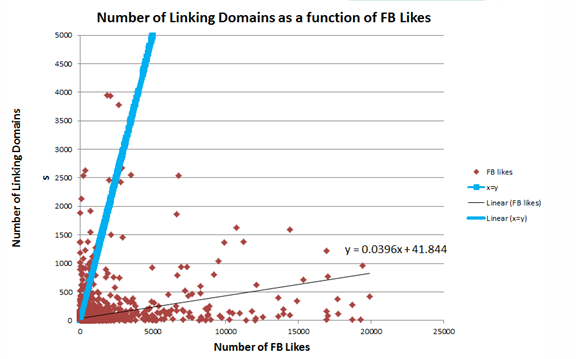


However, the picture changes when we look at the number of links and unique linking domains as a function of +1s:


As you can see from the above charts, +1 trendline slope is higher than the benchmark a=1 value, both in case of back-links and linking domains. If we compare the values of the slope (“a”) from each social media channel plotted against links, we can get a better idea of the difference between different channels. If we look just at RTs, FB Shares and FB Likes, we see that they are all pretty similar:

Again, I want to warn, these numbers cannot be used as an absolute measure of social media effectiveness in link building, i.e. we cannot say for example “the slope of the RT trendline is 3 times as much as the slope of the FB shares trendline, therefore RTs are 3 times as effective for link building as FB Shares”. This is wrong!! However, when we look at the slope values of all the social media channels, compared to the slope values of +1s, we can see that there is a significant difference:

Since there is a difference of about 1.5 orders of magnitude (in one case) between the effectiveness of +1s and the link building effectiveness of other social media channels, we can assume that in this niche, based on the very limited number of source URLs (remember, we gathered this data using only 2 URLs as the starting point!!) +1s will probably outperform other social media channels in terms of link building. When you think about what were our starting data points (2 articles on use of Excel for SEO), this kinda makes sense, since the marketers are very likely to use the +1 button and to expose other marketers in their network to that content.
Further data analysis
So what about this makes it a “minesweeper effect”? It mostly the fact that we started from two data points and ended up with many many more URLs/twitter usernames to work with in our link building outreach

Here are just some of the initial ideas about what can be done with the gathered data:
- Prune out the “selfish” users – you can run a quick check on what is the domain of the URL listed in the user profile and what percentage of tweets published by that user mention URLs belonging to this domain. People/accounts that mostly tweet their own stuff are probably doing it as an act of self-promotion and will find little interest in tweeting your linkable content. On the other hand, these users will make good targets of ego-bait.
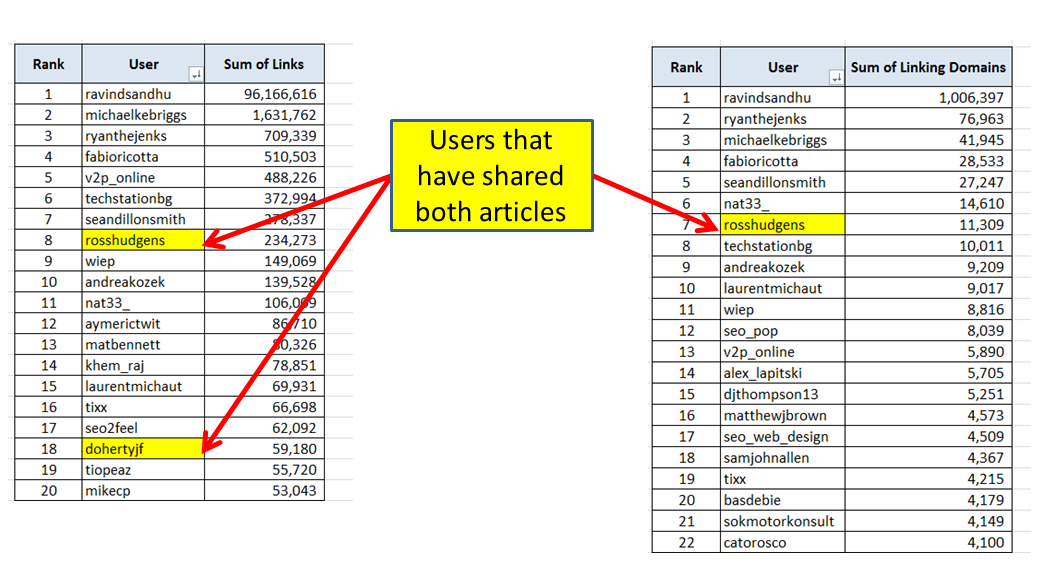
- Identify power users – you can make a breakdown of how many links/unique linking domains have URLs featured in specific users’ tweets gathered and try and communicate with the most prolific users, from the aspect of link creation. It would probably be a good assumption that the users with a huge number of links created to the content they shared are not such a good social media target, similarly to the users that share content no one links to. Every campaign should aim for finding the “sweet spot” somewhere in the middle between those two extremes.Another category of power users are users that have shared both our initial articles. Imagine running this report on 10 or 100 competitors’ articles, the number of times a certain username appears in the list of users that have retweeted that content becomes a very relevant metric, enabling you to pinpoint the users that have displayed across the board interest in the same type of content you are wanting to create:
- You can identify relevant users by searching Twitter directory and analysis services (such as https://followerwonk.com/). First perform a search at the relevant directory and get a list of usernames, which can be then cross checked against the list you have gathered and mark those that appear on both. Those will be your users that are relevant to your topic AND have shared content similar to what you are aiming to produce. That is some pretty powerful granular profiling of Twitter users for link building needs.
- Add keyword relevance data to the list of domains on which shared content is located – a simple [site:domain.com keyword] search will give you a number of keyword-relevant pages on each domain that we have on our list. More keyword-relevant pages a site has, higher its potential linking value it is and its value as a potential link outreach target increases.
- Create a pool of relevant domains for future link building outreach campaigns – in this case we have targeted two pieces of content relevant for [Excel for SEO] group of keywords. We can feed all the gathered domains into a Google Custom Search Engine and every time we want to start a link building outreach, search on domains that were known to be valuable link outreach targets due to their sitting at the intersection of relevance and social media interest.
- Filter the domains according to whether they are already linking to you or not linking to you and already linking to your competitors or not yet linking to your competitors.
- Calculate the average RT/FB Likes/FB Shares to Links ratio in your niche and identify users/domains that constantly perform above that ratio – those are the preferential link outreach targets.
- Perform exactly the same content analysis after a set period of time (week or two weeks) and calculate the RT/FB Share/FB/Like/+1/Link difference between the two dates. Then look for users that provide the largest delta in each category. Also look for domains whose content attracts most social media-originated links from the list.
These are some of the ideas we thought of as we built the tool. The beauty of the minesweeper effect is that you can take this method and the data any way you wish and/or find useful.
Branko Rihtman started out in the world of SEO in 2001. Since then he has helped numerous companies increase revenue in some of the most competitive online niches. Over that time, he realized that the SEO competitive advantage is to be found in proper testing and analysis and has started applying his scientific training to plan and execute extensive SEO experiments.
Branko completed his M.Sc. in Microbial Ecology in Hebrew University, Jerusalem. He was a featured speaker at a number of leading SEO conferences in the US and in Europe, such as LinkLove London, SMX advanced, Sphinncon, MIT Forum, Affilicon, etc.
Branko joined RankAbove in October 2011.
About the author
Comments
Comments are closed.
Great post Branco,
I really enjoyed your Linklove presentation and found your approach really interesting and reasonable. It can certainly be very useful to curating new content ideas based on what has already been shared socially at international level. However, I\’m not sure about how long such a process would take to set up, nor whether the outcome would be something useful/actionable. I guess that for some niches it would be more successful than others .
Do you have any examples to share where you have successfully applied it?
Hm, I can\’t really expand on specific examples, but we have seen some success with this kind of tactics in entertainment-related niches
Hi Branko,
Intriguing stuff. One question, though: How do you handle the time lag between a post/like/tweet and Majestic crawling the link graph? Are you just assuming it\’ll be a few weeks, and waiting that long?
Hi Ian,
Thanks for commenting. It is a good point you are raising, but
1. Majestic\’s Fresh Index is pretty good with picking up links fast. If you download the spreadsheet at the bottom of the post and feed it some fresh content, you can see that the number of links gets updated relatively quickly
2. Majestic/Ahrefs data is the freshest there is on the market at the moment, so while it may not be optimal, it is the best available information
3. It is important to remember that you are not only getting data on the fresh content. When you look at the content that was shared by someone that has also shared content that interests you, you are looking at 200-300 shared URLs. That can spread over couple of months, in which case Majestic will most definitely have enough relevant data.
4. I think I mentioned in the post, but if not, I will mention here – there is also some value to be found in measuring the change in number of links over time for socially shared content, so having no index links at the beginning is a great equalizing line for the content you are measuring the link velocity for.
Again, thanks for commenting and glad you found it interesting
Bookmarked!
Great article there!
But isn\’t it true, that this approach is really useful only when dealing w/ a pre-existing market that has already been *heavily* manipulated by others? … After all, strength (Of ur approach) is based on accumulating large data sets. And thus, is only obtainable after others have already played the field and you becoming, by default, a late arrival … Forcing you to leg behind and a start at a disadvantage!
What I\’m really trying to say is – Isn\’t it a better idea & investment of resources, to figure where others have NOT yet invested themselves and thus make for an easier field of play?
Not at all. I am taking competitor\’s content and looking at those that have shared it – what else they have shared. Unless the competition is doing the same process, they are not looking at the same things like I am looking.
Also, you are looking at the process only from the perspective of finding places to ask for links. I have mentioned a few other ways to use the process: gathering list of social media targets (users). Analyzing the types of shared content that have gathered most links and creating similar type of content.
Another thing is that the \”field\” I am playing here is highly fluid. In the article, I talk about starting out from 2 initial articles. The \”field\” will be completely different if I use 4 articles. Not to mention the possibility of using 10 articles. Even if the competitor is using the same technique and choosing different seed articles, our \”fields\” can be very different one from another.
And finally, rarely are you completely new to a field. Not much new under the sun. if there is money in a niche, there are players, you can be sure of it. So you can get advantage over them by using this technique (hoping they are not 🙂 ). You can get advantage over them by using a different set of seed articles than they do. You can only look at websites that are not already linking to them. There is a lot you can do to make your efforts unique. But also, there is something to be said in favor of splitting your efforts into a direction where you are doing what the competitors are doing, just a bit smarter and bit better and the direction in which you are doing completely new things. Knowing what works and what doesn\’t (from watching the competitors) can be a huge time and money saver. As for competitive advantage, you don\’t have to copy the competitors. You can copy the principle behind their ideas and improve on them. Advance through small, incremental steps.
Not arguing your approach and its obvious benefits.
But, as it seems to require quite a large investment in resources (Time, infrastructure, training …) – I\’m still not sure that allocating a similar amount of resource, in trying to identify a less competitive niche, or even create a new niche, for your client – is not a approach. In that, I also take into account that when entering an already active & competitive niche – One must expect that minimum allocation of resource for the day-to-day SEO needs will be a not so low one.
On the other hand, when you are able to create a new niche – It is expected that u\’ll be able to secure your clients position for a much lower cost.
Correlation between competitiveness and volume of traffic (and thus profitability) is very high, IMHO. Carving out a new niche is all well and good but from what I have seen and heard from other people, it happens rarely in profitable areas. So this option is available to only a small number of people and for a short period of time.
This approach is relevant to people that have (for whatever reason) decided to turn to social media for link building outreach. Maybe they did all the rest. Maybe their competitors are not using social media for linking and they have recognized a competitive gap there. So (IMHO) this method will provide them with somewhat more focused and targeted approach.
The argument about other tactics being a better investment of time can always be made, for any approach.
As for this representing a large investment in resources, I have spoken to people that have heard the presentation at the conference and have started using some of the tactics and tools outlined here and have said that this is making the task easier for them. So I guess it is all a matter of starting point.
Thanks for your remarks 🙂
brilliant piece of writing.. I honestly enjoyed going through it
all, and many thanks for the tips and information !
!
What\’s up, Branko! Any plans to productize this process into a turnkey platform? If not, let\’s talk.
Yo Hugo, long time 🙂
So we are incorporating this into our Social Media module in Drive. Additionally, as I am learning RoR at the moment, I am keeping this as a project through which I am learning the ropes of coding. When I am done, I am planning to release it as a free tool, with limited capabilities. Be in touch through mail or DMs, let\’s see if we can join forces.